Energy Level Diagram For Hydrogen Atom-
Before you go through this article, make sure that you have gone through the previous article on Bohr’s Atomic Model.
We have learnt that-
- Electrons revolve around the nucleus in fixed energy orbits called as stationary states.
- When an electron makes a transition from any higher energy level to a lower energy level, the difference of energy appears in the form of a photon.
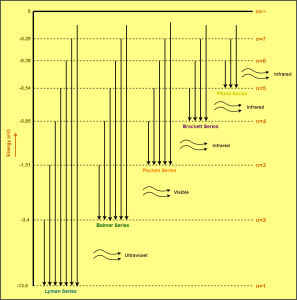
- This results in the emission of line spectrum.
- The origin of various spectral series in the hydrogen atom are also discussed.
In this article, we will discuss about energy level diagram for hydrogen atom.
Energy Level Diagram-
| Energy level diagram is a diagram in which the energies of the different stationary states of an atom are represented by parallel horizontal lines drawn according to some suitable energy scale. |
Energy level diagram illustrates more clearly the known facts about the stationary states and the emission or absorption of various spectral lines.
From Bohr’s theory, the energy of an electron in the nth Bohr orbit of an atom is given by-
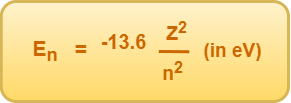
For hydrogen atom (Z=1),
- The total energy of electron in 1st Bohr orbit is E1 = -13.6/12 = -13.6 eV
- The total energy of electron in 2nd Bohr orbit is E2 = -13.6/22 = -3.4 eV
- The total energy of electron in 3rd Bohr orbit is E3 = -13.6/32 = -1.51 eV
- The total energy of electron in 4th Bohr orbit is E4 = -13.6/42 = -0.85 eV
- The total energy of electron in 5th Bohr orbit is E5 = -13.6/52 = -0.54 eV
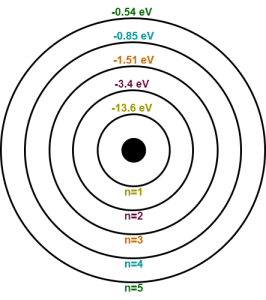
Now, the energy level diagram for hydrogen atom may be drawn as-
Read the next article on-
Limitations of Bohr’s Atomic Model
Get more notes & other study material of the Chapter Atoms.